How to Debug Salesforce Flows: Step-by-Step Troubleshooting Guide
Feb 11, 2025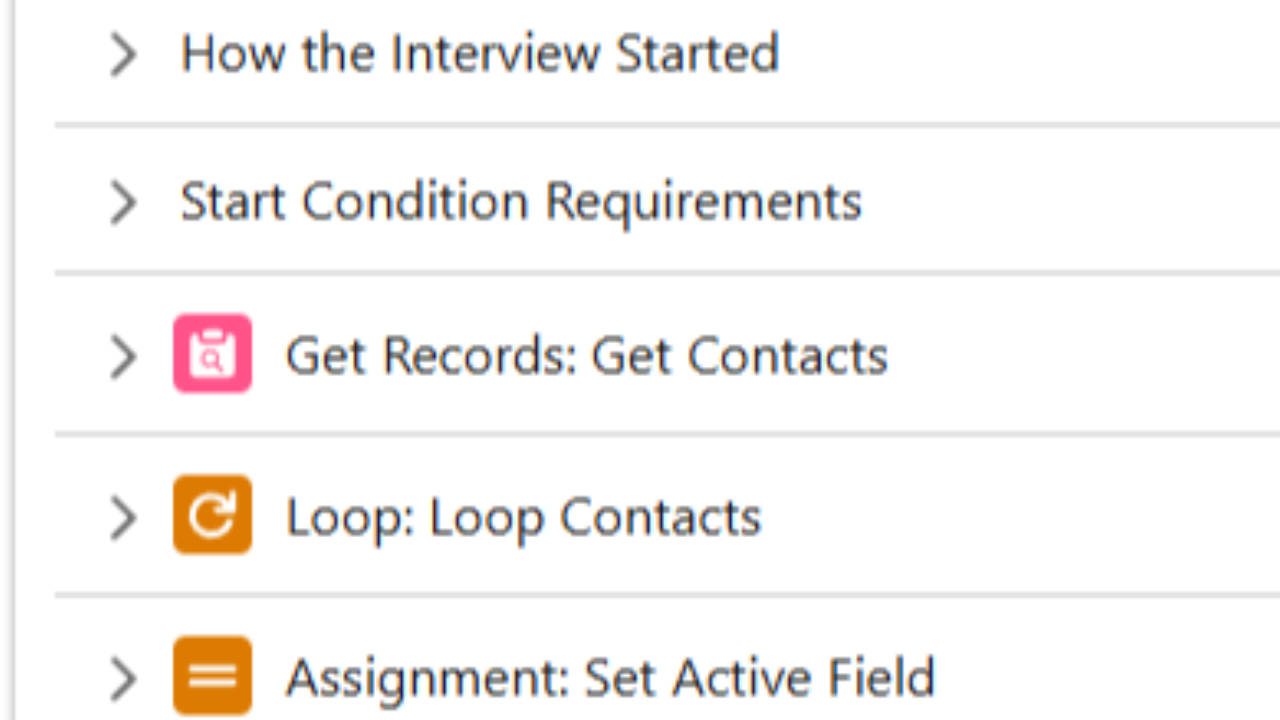
Introduction
Debugging Salesforce Flows is a critical skill – especially as your flows grow more complex. Even a simple mistake in logic or a missing field can cause a Flow to fail silently or throw errors, so being able to pinpoint issues quickly is vital. Proper debugging ensures your automations run smoothly and helps maintain user trust. However, many admins and developers struggle with troubleshooting flows due to a lack of insight into what the Flow is doing behind the scenes. Common challenges include not knowing which element caused a failure, difficulty tracking variable values as the Flow runs, or confusion over cryptic error messages (like “unexpected null value”). In this article, we’ll break down exactly how to debug Salesforce Flows step by step, so you can immediately diagnose and fix Flow issues with confidence.
Step-by-Step Salesforce Flow Debugging Guide
Using the Built-in Debug Tool in Flow Builder
Salesforce provides a powerful built-in debugging tool right in Flow Builder. This Debug Mode lets you run the flow in a test context and watch each step execute in real-time. It’s the fastest way to see what’s happening inside your Flow without affecting real data. To use it:
- Open your flow in Flow Builder and click the “Debug” button: In Flow Builder, you’ll find a Debug button at the top of the canvas for most flow types. (Platform Event-triggered flows are an exception – they can’t be run in Debug Mode)
- Set debug options and inputs: You can specify things like which record to run the flow on or input variable values. For example, for a record-triggered flow, you might enter a Record ID or set a checkbox to simulate the trigger conditions. For screen flows, you can simply start without needing an ID. You also have advanced options (depending on flow type), such as running as another user, skipping start conditions, or running in rollback mode (so no changes are actually saved). Choosing “Run in rollback mode” is a best practice while debugging to avoid making real changes to your data.
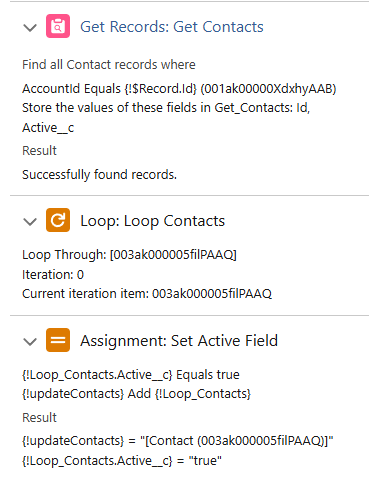
- Run the debug session: Once your options are set, click Run (or Run Flow). The flow will execute step by step. In the debug panel, you’ll see a detailed readout of each element execution, outcomes of decisions, and changes to variables. Watch the variable values update as the flow progresses. For example, when a Get Records element runs, the debug details will show how many records were retrieved; when an Assignment runs, you’ll see the new value assigned to the variable. This real-time insight is like having an x-ray of your flow’s logic.
- Review the results: After the flow finishes (or hits an error), examine the debug details. The debug screen clearly highlights which path was taken at each Decision, what data was passed into subflows or Apex actions, and where any errors occurred. If an error happens, you’ll get an error message in the debug log output. Use this info to identify the failing element and the state of your variables at that point. A good practice is to test multiple scenarios in Debug Mode – for instance, if your flow has different decision branches, run the debug for each branch logic if possible. Also, if your flow updates or creates records, use rollback mode or do your debugging in a sandbox to avoid unintended data changes.
Best practices for Debug Mode: Treat Debug Mode as your first line of defense. Make one change at a time and re-run the debug to see its effect. Pay close attention to the order of execution and ensure the flow’s behavior matches your expectations. If your flow involves user interaction (screen flows), use Debug to step through the screens and confirm they display correctly. Remember that Debug Mode runs in the context of your user by default – if your issue might be permission-related, use the “Run as another user” option to replicate how it runs for others. Overall, the Flow Builder’s debug tool is an excellent way to validate logic in real time, catch obvious errors, and verify that each part of your flow works before deploying it.
Setting Up Debug Logs for Flows
While Debug Mode is great for interactive testing, sometimes you need deeper insight or to troubleshoot flows that run in the background (e.g. record-triggered or scheduled flows running outside of Flow Builder). This is where Salesforce Debug Logs come in handy. By configuring debug logs, you can capture a detailed log of everything that happens during a flow execution – including database operations, logic branches, and any errors. Debug logs are especially useful for flows that you can’t easily run with the Debug button (like an auto-launched flow invoked by a trigger), or for reviewing flow behavior after the fact.
How to enable debug logs for a Flow: Salesforce doesn’t log flow details by default, but you can turn it on in Setup. Here’s how:
- Go to Setup and search for “Debug Logs” in the Quick Find, then select Debug Logs.
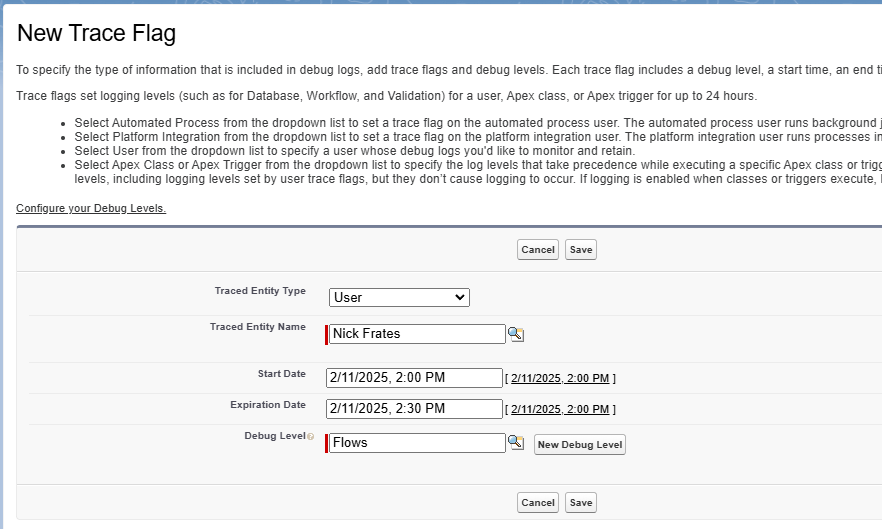
- Click the “New” button to add a new monitored user for logging. Select your user (or whichever user will run the flow) as the monitored user. You can set a timeframe for how long logging is active (e.g. 30 minutes or an hour while you test).
- Set the log level to capture flows: Assign a Debug Level that has Workflow set to Fine (or finer) and Apex Code set to at least Debug. The “Workflow” category in debug logs includes Flow actions, so setting it to a finer level ensures the log will include each Flow element execution and variable assignment. (If you use the standard “Workflow” debug level that is Info or lower, you might miss detailed flow info. Setting Workflow to FINER will show assignment actions and values in the log.)
- Click Save. Now, perform the actions that run your flow (for example, create or update a record to trigger it, or run it from Debug if it’s autolaunched). Ensure you do this while the debug log is active for your user.
After running the flow, return to Setup’s Debug Logs section and refresh the log list. You should see one or more log entries. Locate the log entry corresponding to your flow run – the Operation will indicate a flow (e.g. it might show operations like /aura):
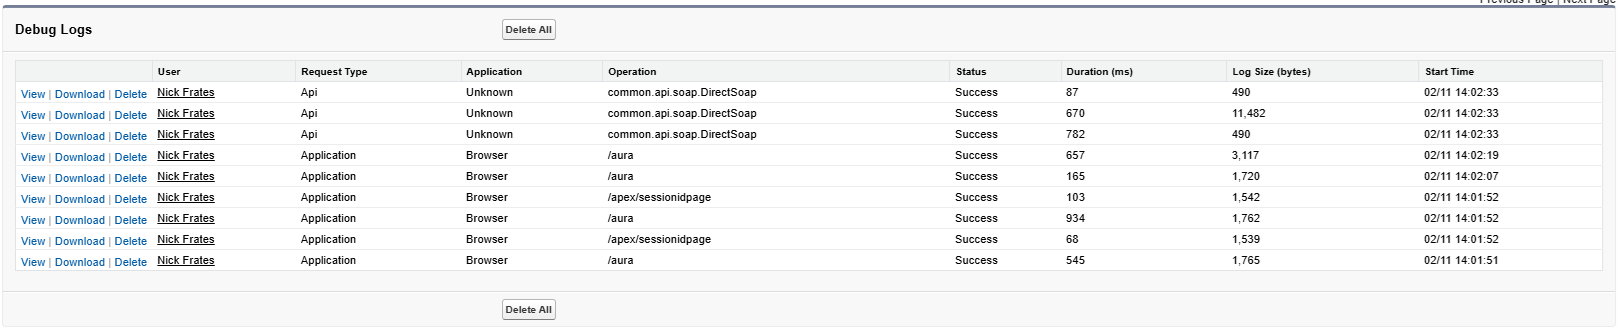
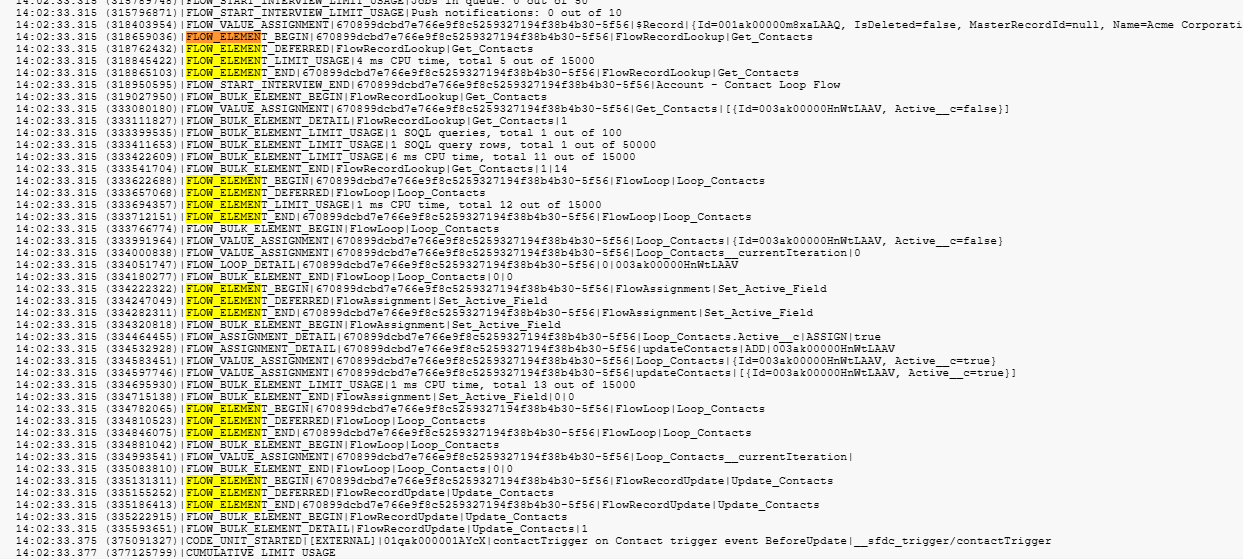
Interpreting Flow debug logs: The log will be a text output of every step that happened. Look for sections labeled FLOW_START, FLOW_ELEMENT_BEGIN, FLOW_ELEMENT_END, etc., which denote flow execution steps. Each element the flow executed will be listed, often with the API name of the element. You’ll also find variables and their values at certain points. For example, an Assignment might show a line like |ASSIGNMENT|myVariable = "ABC" in the log. If an error occurred, search for “EXCEPTION” or the error text; the log will usually show the exception and which element caused it. Debug logs can be verbose, so it helps to use your browser’s find feature to search within the log for your flow’s name or element names. By reading through the log, you can trace the exact path the flow took and see where things went awry. This is extremely useful for catching issues like a record not being found by a Get, a null pointer on a field, or a permission issue – the log will often include an error message that wasn’t visible to the end user.
One pro tip: Debug levels and filtering. To reduce noise, you might create a custom debug level where only Workflow (Flows) is set to a fine level, and others (like Apex, Validation, etc.) are set to error or none, so your logs focus mainly on flow details. Also remember to deactivate or remove debug log entries when you’re done (Salesforce limits the number of active debug logs and the log size). Using logs in combination with Flow’s Debug Mode gives you a 360° view of your flow’s behavior – interactive testing plus a forensic log for deeper analysis.
Additional Debugging Tips for Flows
Beyond the basic tools, here are some extra tips to help troubleshoot and harden your flows:
-
Use Fault Paths (Fault Connectors) to capture errors: Every Data element (like Get, Update, Create, Delete) in Flow can have a Fault path (the little red connector). Always connect fault paths to either a Screen (in screen flows) or a Subflow/Assignment that logs the error (for auto processes). This way, if an error occurs (say a record update fails due to validation rules or permissions), the flow won’t just fail silently or email an admin – it will execute the fault path. You can display a friendly error message to the user or record the error details in a custom object or debug log. Using fault connectors not only improves user experience but also makes it easier to troubleshoot problems in your flows. By handling exceptions, you’ll immediately know when something goes wrong and where, instead of scratching your head over an unanticipated failure.
-
Perform record-based testing in a sandbox: It’s one thing to run a flow in Debug Mode with hypothetical inputs; it’s even better to test it with realistic data in a safe environment. In a sandbox org, create or use sample records that mirror production scenarios, then run your flow against them. This helps catch data-specific issues. Sometimes, a flow might work in Debug Mode but fail with actual data. For instance, if a required field is blank on a real record, the flow could throw an error that you didn’t see in a controlled debug test. By testing with actual record data, you ensure your flow works end-to-end. (Always do this in a sandbox or Developer org – never test new flows on live production records!). Salesforce’s debug tools even allow you to debug as another user, so you can simulate how the flow runs with different field values and permissions. The key is to make your testing as close to reality as possible.
-
Leverage error emails and Flow interview logs: When a flow fails in production, Salesforce will send an automated flow error email to the last person who modified the flow (by default). Don’t ignore these! The email includes the error message and even a link that opens the exact version of the flow that failed, with the failed element highlighted. This can save you a ton of time – you can literally click the link and start debugging the flow in Flow Builder on the spot. Additionally, Salesforce keeps a log of failed flow interviews. In Setup, you can go to Paused and Failed Flow Interviews to see any flow runs that errored out or paused. From there you can open the flow in the state it failed. Use this after-the-fact when a user reports “something went wrong” but you weren’t there to debug live. It’s an immediate clue to what happened.
-
Check “Paused And Failed Flow Interviews” for running or stuck flows: Similar to the above, if you suspect a flow is hung up or not completing (perhaps a pause element waiting on something), you can check Paused And Failed Flow Interviews in Setup. This isn’t needed for most simple flows, but for long-running flows or those that pause, the Paused And Failed Flow Interviews can show you if a flow is in progress or suspended at a certain step, which might explain behavior. Clearing out stalled interviews can sometimes resolve issues (after you’ve identified why they got stuck).
With these additional strategies, you’ll be able to catch errors early and ensure your flows are robust. Debugging isn’t just about fixing what’s broken – it’s about building guardrails (like fault paths and tests) so that your flows handle the unexpected gracefully.
Common Debugging Mistakes and How to Avoid Them
Even experienced admins can fall into some traps when debugging flows. Here are some common mistakes and how you can avoid them:
-
Not using Fault Paths for error handling: A frequent mistake is leaving out fault connectors on Flow elements that can fail. Without fault paths, any runtime error (like a DML failure or missing record) will cause the flow to error out and just send an email. That’s a missed opportunity to handle the error gracefully. Solution: Always add fault connectors to critical elements. For screen flows, direct faults to a screen that shows a user-friendly error message. For auto-launched flows, you might route faults to update a log record or send a notification. This way, you catch issues within the flow and can even guide the user or admin on next steps. It makes debugging far easier because you’ll know which element failed and why, right when it happens, rather than after the fact.
-
Debugging (and building) in Production instead of Sandbox: It can be tempting to build a quick fix directly in production or run debug there “just this once.” This is risky and considered bad practice. You might accidentally modify real data or disrupt users. Moreover, production doesn’t allow you to create test records freely or run thorough experiments. Solution: Do all your flow development and debugging in a Sandbox or Developer org. Salesforce professionals consistently advise never to build directly in prod. In a sandbox, you can use the debug tools with no risk to live data, and test various scenarios (including negative tests) freely. Only after you’ve fully debugged and tested the flow in sandbox should you deploy it to production. This ensures you catch issues early and protect your org’s integrity. By adhering to this, you won’t inadvertently turn a small flow bug into a big production incident.
-
Overcomplicating flows without incremental testing: Salesforce Flows are powerful, but if you cram too much logic into one flow without testing along the way, you’re likely to run into trouble. Building a huge flow and then pressing “Activate” without intermediate tests makes it hard to know where something went wrong. Solution: Build your flow in small sections and test each “checkpoint.” A great approach (as outlined in our Flow Building Framework guide) is to break the flow into logical chunks. For example, build and test that the trigger and first Get Records work (ensure the flow fires and finds records). Then add the next element (say a Decision) and debug again, and so on. By “stacking small wins” you can isolate problems immediately. If something fails, you know it’s in the last chunk you added, not somewhere in 100 elements. This incremental method saves time and frustration. It also keeps your flows simpler and more modular, which means fewer places for bugs to hide.
-
Relying solely on Debug Mode without real-world testing: Debug Mode is fantastic, but it runs in a controlled environment and might not catch all issues. A common mistake is assuming that if a flow “works in Debug” then it will work in reality – not always true. We’ve seen cases where a flow debugged without errors, but when activated on a real record, it failed. For example, trying to set an Address field in a flow can “successfully” run in Debug Mode, yet throw an error at runtime when used on a record. This happens because Debug Mode doesn’t always replicate certain platform nuances (like required field checks, or specific field behaviors) exactly as they occur in real operations. Solution: Always follow up your Debug runs with a test on a real record (in sandbox) or use Salesforce’s new Flow Test feature if available. If your flow is record-triggered, activate it in a sandbox and perform the actual record action to trigger it, then check the outcome (and debug logs). This real-world validation will catch issues that a synthetic debug might miss – for instance, picklist value mismatches, permission problems, or in our example, address fields that need to be handled as individual components. In short, trust Debug Mode to guide you, but verify with actual data before declaring victory.
By being mindful of these pitfalls, you can avoid hours of headache. Incorporating error handling, using proper environments, and testing methodically will make your Flow debugging process much smoother. As you gain experience, you’ll start anticipating these issues before they happen – but until then, let these common mistakes be lessons learned the easy way (from others!) rather than the hard way.
Conclusion
Troubleshooting Salesforce Flows doesn’t have to be a daunting task. By leveraging Salesforce’s built-in tools – Flow Builder Debug Mode, Debug Logs, Fault Connectors, and more – you can systematically break down any flow and find out exactly what’s happening at each step. We’ve shown how using these tools in tandem gives you immediate insight and long-term audit trails to resolve issues quickly. Remember, the key is a methodical approach: start in a safe environment, test incrementally, handle errors gracefully, and never be afraid to dive into debug logs for the full story. Debugging is a skill, and like any skill, it gets easier with practice.
By mastering these debugging techniques (and following Flow best practices to avoid issues in the first place), you’ll build more reliable, error-resistant flows that keep your org running smoothly. No more mysterious errors or frustrated end users – you’ll be the Flow troubleshooting hero of your team!
If you found this guide helpful and want to deepen your Salesforce Flow expertise, consider enrolling in our comprehensive course: 2025 Salesforce Flows: The Complete Guide. In this 15-hour project-based course, you’ll learn not just debugging, but all aspects of building Flows like a pro – from fundamentals to advanced patterns. Future-proof your skills and become the go-to Flow expert in your organization.
Additional Resources: For further reading, be sure to check out our other Salesforce Flow articles on NickFrates.com, such as Salesforce Flow Best Practices for Efficient and Scalable Automation and the Flow Building Framework for designing flows with easier debugging in mind. These will complement your debugging know-how with design strategies to minimize errors. Happy Flow building, and happy debugging!
Salesforce Saturdays
Join the Salesforce Saturday newsletter. Every Saturday, you'll get 1 actionable tip on Salesforce technology or career growth related to the Salesforce Industry.
We hate SPAM. We will never sell your information, for any reason.
